2026.05.20
Causal Inference and Missing Data Analysis

- Masayoshi Takahashi
- Associate Professor, Faculty of Economics, Chuo University
Areas of Specialization: Statistical Science, Economic Statistics, and Political Methodology
1. Introduction
In today's world, hardly a day passes without encountering terms such as data science, big data, and AI. Consequently, knowledge and skills in utilizing data have become increasingly important. My previous employer, Nagasaki University, established a new school (School of Information and Data Sciences) in April 2020 specializing in data science, big data, and AI. At the school, I was responsible for teaching specialized courses on causal inference in statistics and missing data analysis. In April 2025, I joined the Faculty of Economics at Chuo University, where I am also in charge of courses on statistics and practical exercises in data analysis.
In the 2000s, I pursued my graduate studies in the United States. I majored in political methodology, which is the study of statistical methods for analyzing political phenomena. Data on political matters are often obtained through surveys or observation. For example, if we want to know the approval rating of a certain administration, we collect data from responses to questions such as "Do you support the current administration?" However, sometimes respondents do not answer the questions. As such, there are frequent instances in which survey and observational data cannot be collected. Such uncollected data are called missing data, which are also referred to as incomplete data. In the 2000s, research on methods for analyzing missing data was actively conducted in the United States in the field of political methodology, led by Professor Gary King at Harvard University (King et al., 2001[1]; Honaker and King, 2010[2]).
Building on my experience majoring in political methodology in graduate school in the United States, I returned to Japan and was later appointed as a senior researcher at the National Statistics Center, an independent administrative institution under the Ministry of Internal Affairs and Communications, in 2011. At the Center, I specialized in the analysis of missing data in official statistical surveys. While engaging in both practical and theoretical research on missing data analysis at the National Statistics Center, I also conducted research for my doctoral dissertation on missing data analysis in the statistics laboratory of Professor Manabu Iwasaki in the Graduate School of Science and Technology, Seikei University. I was awarded a Ph.D. in Science and Technology in 2017.
As causal inference is said to closely related to the issue of missing data, active research was conducted on both causal inference in statistics and missing data analysis in the statistics laboratory of Professor Manabu Iwasaki in the Graduate School of Science and Technology, Seikei University. Professor Iwasaki published Statistical Analysis of Incomplete Data (EconomistSha Publishing)[3] in 2002 and Causal Inference in Statistics (Asakura Publishing)[4] in 2015. After obtaining my Ph.D., I published Missing Data Analysis (Kyoritsu Shuppan)[5] in 2017 and Theory and Implementation of Causal Inference in Statistics (Kyoritsu Shuppan)[6] in 2022. In this article, I provide an overview of my research field of causal inference in statistics and missing data analysis, illustrated with simple numerical examples where appropriate.
2. Difference between correlation and causation: Analysis based on correlation
Anyone taking a statistics course or reading a statistics textbook will almost certainly be taught that correlation and causation are different. However, exactly how do they differ? Figure 1 shows a scatter plot of the number of Nobel Prize winners per 10 million people and chocolate consumption per capita (kg) for each country. From Figure 1, it appears that countries with higher chocolate consumption tend to have more Nobel Prize winners. The correlation coefficient is calculated as approximately 0.7. In Figure 2, the red line represents a model of this scatter plot, which can be expressed by the following equation.
Number of Nobel Prize winners = -3.4 + 2.7 × chocolate consumption
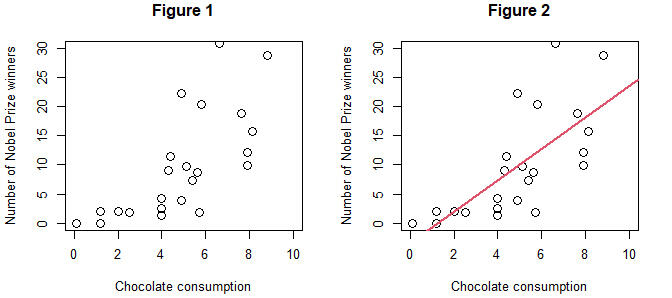
What interpretation can we draw from Figures 1 and 2? The correlation coefficient ranges from -1 to 1, with values close to 1 indicating a strong positive correlation and values close to -1 indicating a strong negative correlation. Since the correlation coefficient here is approximately 0.7, we can interpret this as indicating a positive correlation between a country's number of Nobel Prize winners and its chocolate consumption. In addition, from the equation "Number of Nobel Prize winners = -3.4 + 2.7 × chocolate consumption," we can also interpret that countries with higher chocolate consumption tend to have, on average, more Nobel Prize winners. Furthermore, using this equation, we can calculate "-3.4 + 2.7 × 5 = 10.1," which allows us to predict and interpret that a country with a chocolate consumption of 5 kg would, on average, have about 10 Nobel Prize winners. It is important to note that this analysis is based on correlation and does not imply a causal relationship between chocolate consumption and the number of Nobel Prize winners.
3. Difference between correlation and causation: Analysis based on causation
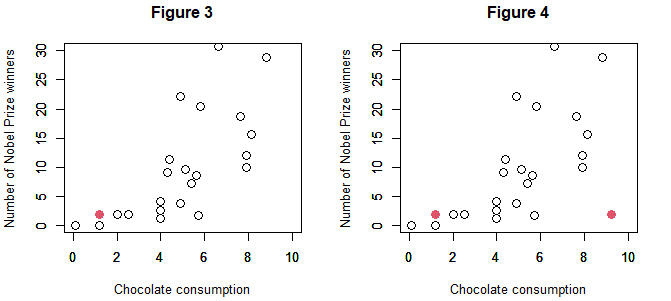
A causal relationship can be defined as follows: "When, holding all other factors constant, manipulating factor X changes factor Y." This is known as the principle of "no causation without manipulation." For example, in Figure 3, Japan is represented in red, where both chocolate consumption and the number of Nobel Prize winners are low. Suppose we want to increase the number of Nobel Prize winners in Japan. If chocolate consumption truly has a causal effect on the number of Nobel Prize winners, then, as illustrated in Figure 4, increasing Japan's chocolate consumption horizontally to around 10 kg should result in a corresponding upward change in the number of Nobel Prize winners. But would the number of winners actually increase?
In the previous section, we used data analysis to confirm a positive correlation between chocolate consumption and the number of Nobel Prize winners. However, it is believed that there is no causal relationship between the two. This is because a common underlying factor is thought to influence both. As shown in Figure 5, that common factor is each country's economic strength. Chocolate is a luxury good, so chocolate consumption is lower in economically poorer countries. Furthermore, research that leads to a Nobel Prize requires a sufficiently well-equipped research environment. Obviously, economically weaker countries are at a disadvantage in terms of conducting research that requires expensive facilities. Therefore, a country's economic strength is considered a common underlying factor affecting both chocolate consumption and the number of Nobel Prize winners. In the previous section, our examination of the relationship between chocolate consumption and the number of Nobel Prize winners did not account for each country's economic strength. In this case, as shown in Figure 6, the causal effect of a country's economic strength on the number of Nobel Prize winners (dashed arrow) follows the pathway through the causal effect of economic strength on chocolate consumption (red arrow), giving the misleading appearance that chocolate consumption causally affects the number of Nobel Prize winners (gray arrow). Therefore, even if Japan's chocolate consumption were to increase to around 10 kg, as hypothesized in the previous section, we do not expect an increased number of Nobel Prize winners in Japan.
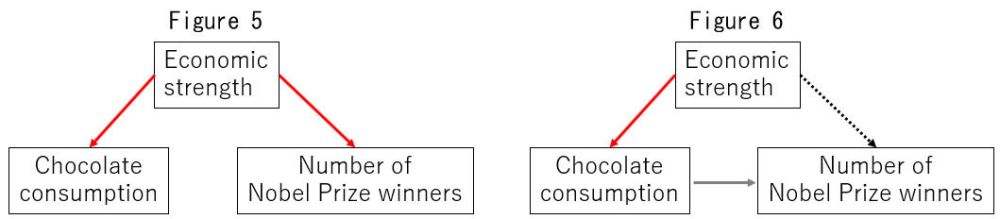
Note: In Figure 6, the dashed line indicates that the factor is not considered.
Thus, when conducting data analysis, it is important to note that the methodology for making predictions is not necessarily the same as the methodology for drawing causal inferences.
4. The Nobel Memorial Prize in Economic Sciences and causal inference in statistics
To use data to analyze how a particular policy affects the economy, it is necessary to appropriately control the many intertwined factors and infer the causal relationships of interest. The concepts and techniques required for such analysis are provided by causal inference in statistics. The 2021 Nobel Memorial Prize in Economic Sciences was awarded to econometricians Angrist and Imbens for their methodological contributions to the analysis of causal relationships. In this way, causal inference in statistics has recently been attracting worldwide attention across a variety of fields.
5. Potential outcomes and missing data
In causal inference in statistics, the principle of "no causation without manipulation" is crucial. For example, suppose we are interested in determining whether issuing a 5% discount coupon to a customer causally increases their spending. As shown in Table 1, let us assume that Customer A did not receive a coupon, and their actual purchase amount was 900 yen. Hypothetically, if Customer A had received a coupon and their purchase amount increased to 1,100 yen, we could claim that issuing a 5% discount coupon causally increased Customer A's spending by 200 yen. On the other hand, suppose that Customer B received a coupon, and their actual purchase amount was 1,000 yen. Hypothetically, if Customer B had not been issued a coupon and their purchase amount had fallen to 850 yen, we could claim that distributing the 5% discount coupon causally increased Customer B's spending by 150 yen.
Table 1
| Name | Purchase amount (with coupon) |
Purchase amount (without coupon) |
| Customer A | 1,100 yen | 900 yen |
| Customer B | 1,000 yen | 850 yen |
However, it is impossible to issue and not issue the same coupon to the same person at the same time. In other words, as shown in Table 2, we can only observe either the scenario in which the coupon was issued or the one in which it was not. Unobservable data are called missing data. Therefore, causal inference is often described as a problem of missing data.
Table 2
| Name | Purchase amount (with coupon) |
Purchase amount (without coupon) |
| Customer A | 900 yen | |
| Customer B | 1,000 yen |
For more details on missing data analysis, please refer to my book Missing Data Analysis (Kyoritsu Shuppan)[5]. For a more in-depth discussion of causal inference in statistics, please see my book Theory and Implementation of Causal Inference in Statistics (Kyoritsu Shuppan)[6].
6. Recent research
In my recent research, I have proposed a new method for addressing outliers in missing data analysis (Takahashi, 2022)[7], as well as a new methodology that extends missing data analysis techniques to causal inference in statistics (Takahashi, 2023)[8]. In collaborative work with researchers in India, I contributed to improved detection of breast cancer by applying missing data analysis methods to deep neural networks (Kanimozhi et al., 2022)[9]. Furthermore, in collaboration with medical researchers, I studied the causal impact of COVID-19 emergency declarations on the physical activity of older adults (Chiba and Takahashi et al., 2023)[10]. Currently, I am investigating new methodologies for high-dimensional missing data[11].
[1] Gary King, James Honaker, Anne Joseph, and Kenneth Scheve (2001). Analyzing incomplete political science data: An alternative algorithm for multiple imputation, American Political Science Review, 95 (1), 49-69.
[2] James Honaker and Gary King (2010). What to do about missing values in time series cross-section data, American Journal of Political Science, 54(3), 561-581.
[3] Manabu Iwasaki (2002). Statistical Analysis of Incomplete Data, EconomistSha Publishing.
[4] Manabu Iwasaki (2015). Causal Inference in Statistics, Asakura Publishing.
[5] Masayoshi Takahashi and Michiko Watanabe (2017). Missing Data Analysis: Single Imputation and Multiple Imputation in R, Kyoritsu Shuppan.
[6] Masayoshi Takahashi (2022). Theory and Implementation of Causal Inference in Statistics: Potential Outcomes and Missing Data, Kyoritsu Shuppan.
[7] Masayoshi Takahashi (2022). A new robust ratio estimator by modified Cook's distance for missing data imputation, Japanese Journal of Statistics and Data Science, 5 (2), 783-830.
[8] Masayoshi Takahashi (2023). Multiple imputation regression discontinuity designs: Alternative to regression discontinuity designs to estimate the local average treatment effect at the cutoff, Communications in Statistics - Simulation and Computation, 52 (9), 4293-4312.
[9] Kanimozhi Ganesan, Shanmugavadivu Pichai, Muthu Subash Kavitha, and Masayoshi Takahashi (2022). Data imputation in deep neural network to enhance breast cancer detection, International Journal of Imaging Systems and Technology, 32 (6), 2094-2106.
[10] Ippei Chiba*, Masayoshi Takahashi*, Sangyoon Lee, Seongryu Bae, Keitaro Makino, Osamu Katayama, Kenji Harada, Kouki Tomida, Masanori Morikawa, Yukari Yamashiro, Naoto Takayanagi, Motoki Sudo, and Hiroyuki Shimada (2023). Association between COVID-19 emergency declarations and physical activity among community-dwelling older adults enrolled in a physical activity measurement program: Evidence from a retrospective observational study using the regression discontinuity design, BMC Public Health, 23 (998), 1-12 (*co-first authors).
[11] Masayoshi Takahashi (2025). Proposal of multiple imputation by the support vector machine for high-dimensional missing data, 69th National Conference of the Japan Society of Economic Statistics.
Masayoshi Takahashi/Associate Professor, Faculty of Economics, Chuo University
Areas of Specialization: Statistical Science, Economic Statistics, and Political Methodology
Masayoshi Takahashi graduated from the philosophy course of the Department of Philosophy in the Faculty of Letters, Keio University in 2001. He earned an MA in Political Science from California State University, Los Angeles in 2004, and an MA in Political Science from Michigan State University in 2008. He Earned a Ph.D. in Science and Technology from the Graduate School of Science and Technology, Seikei University in 2017. He served as a senior researcher at the National Statistics Center, an independent administrative institution, from 2011 to 2016. After serving at Tokyo University of Foreign Studies, Tokyo Institute of Technology, International University of Kagoshima, and Nagasaki University, he assumed his current position at Chuo University in 2025. He is the recipient of the 2019 Japan Society of Economic Statistics Award.
His main written works include Theory and Implementation of Causal Inference in Statistics: Potential Outcomes and Missing Data (Kyoritsu Shuppan, 2022), and more.
