2022.08.23
Will the COVID-19 Pandemic Promote Suburbanization and Relocation/Migration to Rural Areas?
Trends suggested by changes in land prices

- Chigusa Okamoto
- Assistant Professor, Faculty of Economics, Chuo University
Areas of Specialization: Urban Economics and Spatial Economics
How has the COVID-19 pandemic impacted land prices?
More than two years have passed since the beginning of the COVID-19 pandemic. Ever since the beginning of the pandemic, the introduction of telecommuting has been promoted as one measure to prevent the spread of infection. Currently, some companies are returning to the traditional style of working in offices, and the extent to which telecommuting will become commonplace in the future is unclear. Nevertheless, the COVID-19 pandemic may have caused some people to reconsider the need for close proximity of their job and residence. In this article, I would like to examine whether the demand for land has actually changed.
Liu and Su (2021) conducted analysis to determine how COVID-19 had impacted housing location demand in the United States. Their paper analyzes monthly fluctuations in home inventory, rent, etc., to determine which areas are experiencing an increase or a decrease in housing demand. Their analysis showed that housing demand has (1) shifted from central cities to the suburbs and (2) shifted from larger cities to smaller cities. The trend for (1) is particularly strong.
Is Japan showing any signs of suburbanization, relocation, or migration similar to the United States? I am currently using the Public Notice of Land Prices (a digital national land information published by the Ministry of Land, Infrastructure, Transport and Tourism) to conduct research targeting all regions of Japan. I will present a portion of my research in this article. In the analysis which I will introduce, I used data for the five-year period from 2018 to 2022. My analysis shows values as of January 1 in each year, thereby making it possible to ascertain long-term trends (plus one year) when compared to the research done by Liu and Su (2021) as of April 2021.
Differences depending on the size of urban areas
Let's begin by confirming whether or not changes in land prices before and after the start of COVID-19 differ depending on the size of the urban area. In my analysis, I use the Urban Employment Area (UEA) proposed by Kanemoto and Tokuoka (2002) as the definition of an urban area. Each UEA is composed of central municipalities called "core" and suburban municipalities called "outlying municipalities."[1] UEAs are categorized into either Metropolitan Employment Areas (MEAs) or Micropolitan Employment Areas (McEAs) according to the population of Densely Inhabited Districts (DID) in the core. According to 2015 standards, there are 100 MEAs and 122 McEAs in Japan. Moreover, some municipalities nationwide do not belong to any UEA. In my analysis, I identified whether each point (standard site) of the Public Notice of Land Prices is included in a MEA, McEA, or outside of a UEA. I then calculated the logarithmic change rate (compared to 2018) of the average land price of each group.[2] Figure 1 shows the change over time.
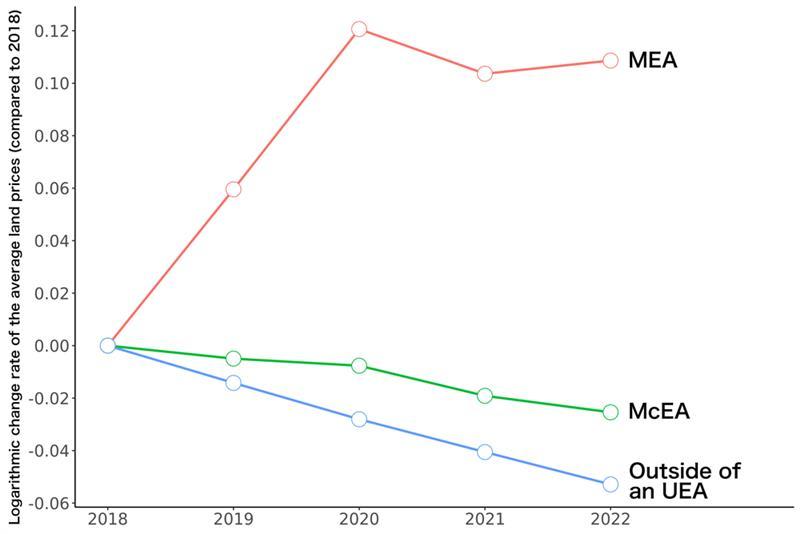
Figure 1: Logarithmic change rate in average land prices (by size of metropolitan area; compared to 2018)
According to Figure 1, land prices in the MEA were on an upward trend before the start of COVID-19. On the other hand, land prices in the McEA and outside of a UEA were on a downward trend. Figure 1 shows that the regional disparity in land prices was steadily widening. However, during the period from 2020 before the start of COVID-19 to 2021 one year after the start, land prices have fallen even in the MEA. Furthermore, the rate of decline is large compared to the McEA and the outside of a UEA. This data suggests that land demand has shifted from the MEA.[3]However, one year later, land prices began to increase again only in the MEA. Accordingly, the shift of land demand from the MEA can be considered as transient. Still, the logarithmic change rate in 2022 compared to the previous year is smaller than the level before COVID-19, and there has not yet been a complete recovery.
Differences depending on location within urban areas: Example based on the Greater Tokyo Area
The analysis discussed above suggested that land prices change differently depending on the size of the urban area. Now, is there a difference depending on location within the urban area? Before examining national trends, let's focus on the Greater Tokyo Area (Tokyo, Saitama, Chiba, Kanagawa Prefectures, excluding the Tokyo Islands), which include most of the Tokyo UEA, and examine the regional distribution of land price changes. The heat maps in Figure 2 to Figure 5 show the year-on-year logarithmic change rate in average land prices for each 1 kilometer mesh.[4] The mesh colored in red (blue) indicates that land prices have increased (decreased) compared to the previous year. The darker the color becomes, the greater the change rate is.
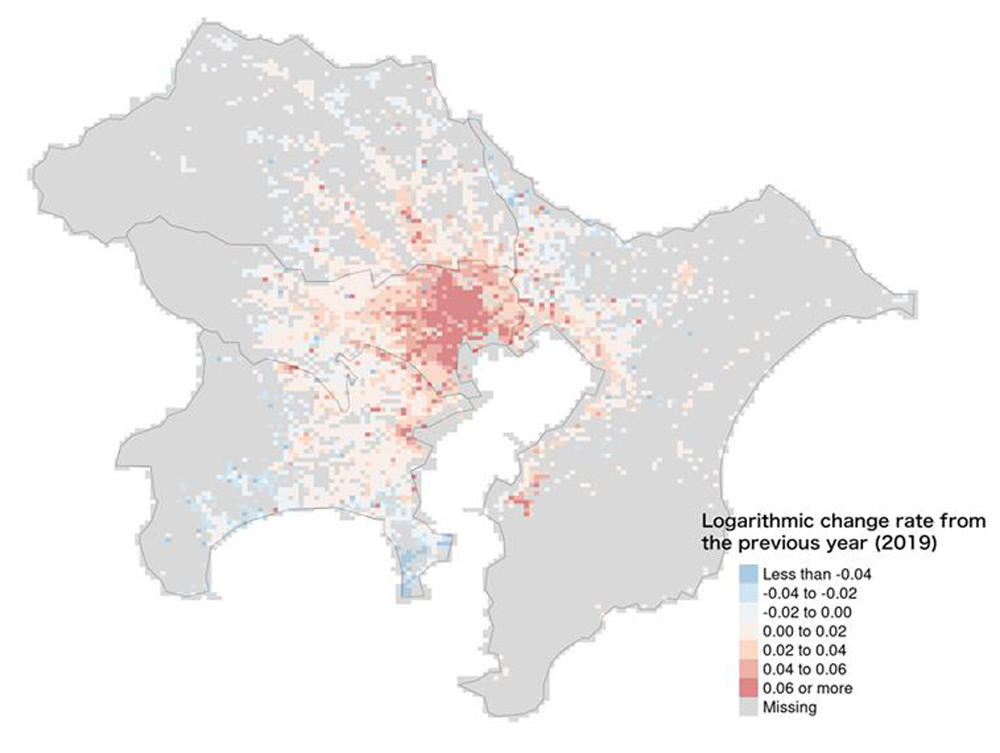
Figure 2: Logarithmic change rate of the average land prices from the previous year (2019)
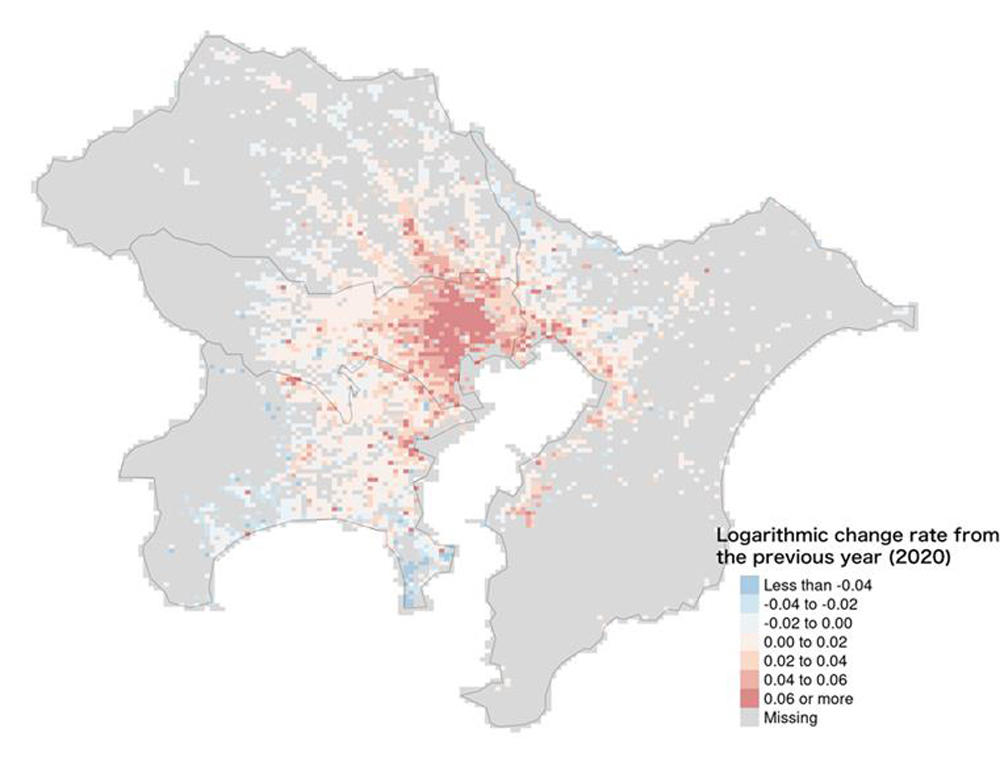
Figure 3: Logarithmic change rate of the average land prices from the previous year (2020)
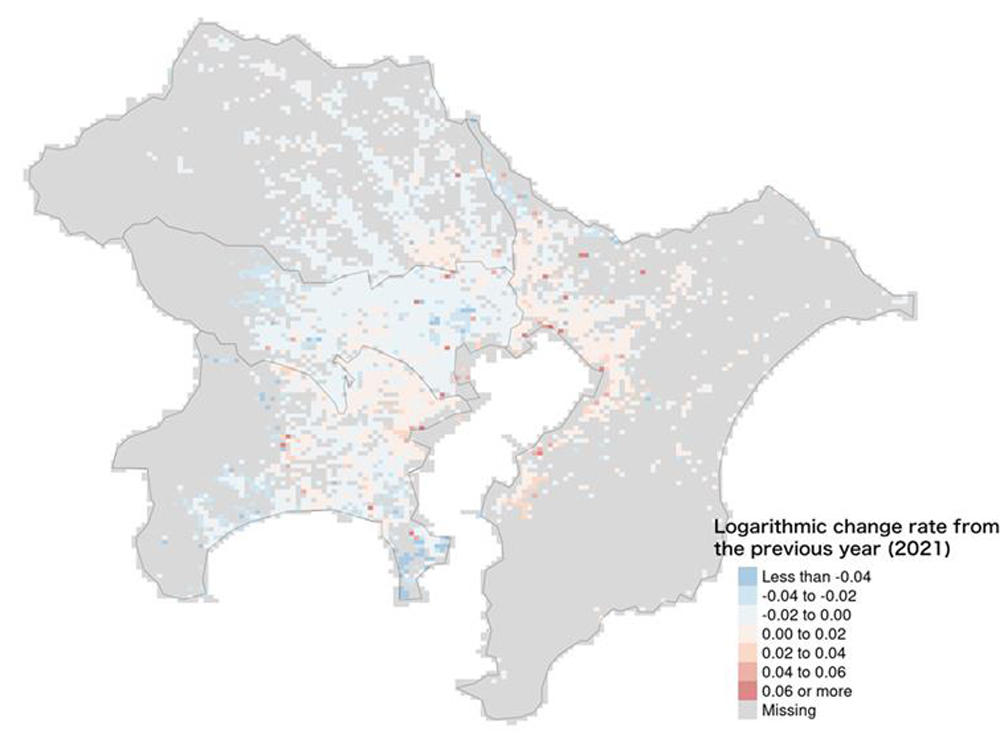
Figure 4: Logarithmic change rate of the average land prices from the previous year (2021)
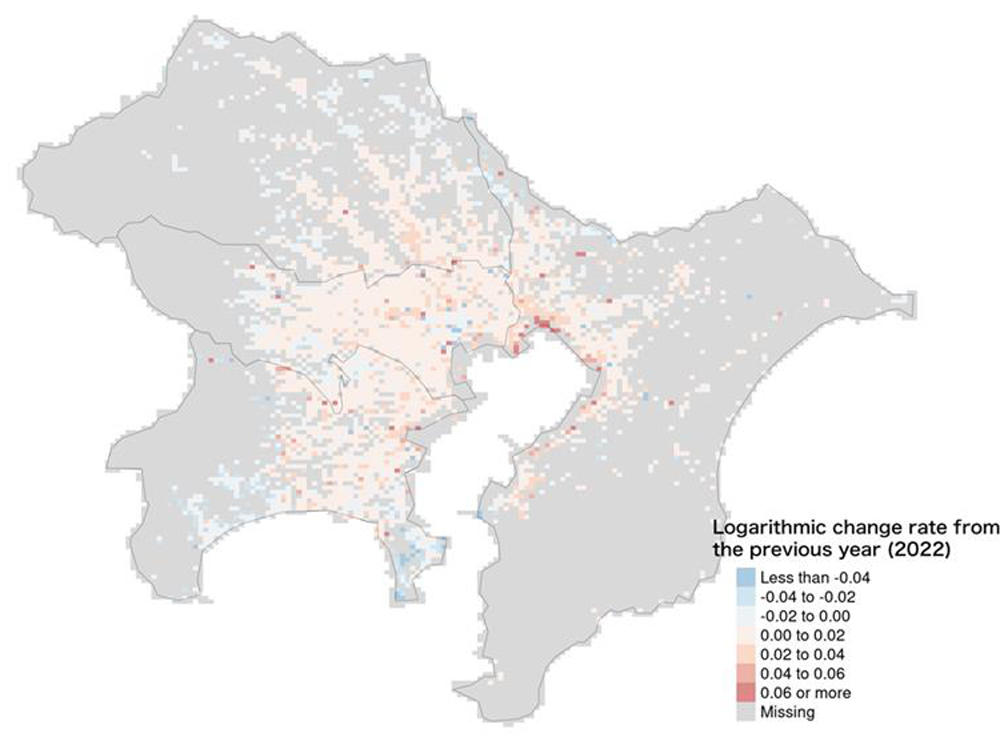
Figure 5: Logarithmic change rate of the average land prices from the previous year (2022)
Figure 2 and Figure 3 show the logarithmic change rate from the previous year as of 2019 and 2020. In these figures, the central part of the Greater Tokyo Area which is based around the 23 wards of Tokyo is colored in deep red. This indicates that land prices were trending upwards in correlation to proximity to the central area prior to COVID-19. However, when looking at 2021 as shown by Figure 4, there is an increase in the ratio of blue mesh for all of the Greater Tokyo Area. In particular, the average land price is declining in about 85% of the mesh for the 23 wards of Tokyo. On the other hand, in some areas adjacent to the 23 wards of Tokyo in Saitama, Chiba, and Kanagawa Prefectures, land prices have maintained an upward trend. When examining 2022 as shown by Figure 5, the proportion of red mesh in the Greater Tokyo Area has begun to increase again to a level approaching what existed before COVID-19. Even so, the size of the change rate has not recovered to the level before COVID-19.
Differences depending on location within urban areas: Nationwide trends
The heat maps shown above make it clear that trends in land prices differ depending on the distance from the central area even within the Greater Tokyo Area. Can this phenomenon be confirmed throughout Japan? To answer this question, I identified whether each point (standard site) of the Public Notice of Land Prices belongs to a core or a outlying municipality. I then classified the points into five groups: 1) core of MEAs, 2) outlying municipalities of MEAs, 3) core of McEAs, 4) outlying municipalities of McEAs, and 5) outside of UEAs. I then calculated the logarithmic change rate (compared to 2018) in average land prices for each group. Figure 6 shows the change over time.
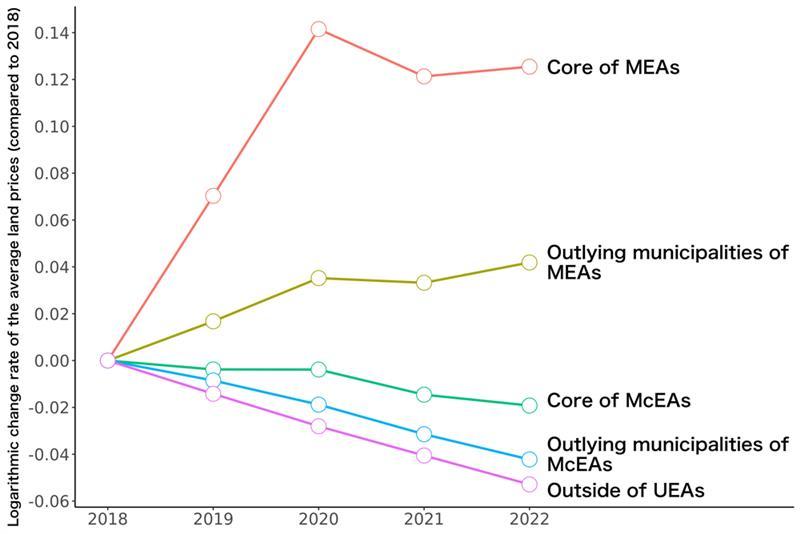
Figure 6: Logarithmic change rate of the average land prices (by urban area size/municipality type; compared to 2018)
According to Figure 6, average land prices declined in all groups from 2020 to 2021. In particular, the highest rate of decline among the five groups was in core of MEAs, while the lowest rate of decline was in outlying municipalities of MEAs. Furthermore, from 2021 to 2022, land prices increased in both core and outlying municipalities of MEAs. The rate of increase was particularly high in outlying municipalities. This suggests that land demand is increasing, especially in outlying municipalities within MEAs.[5]
The content which I introduced in this article was analysis using figures and heat maps. Currently, I am working to perform even more detailed and accurate analysis, which requires the use of statistical methods. At the current stage, similar to Liu and Su (2021), I obtained results consistent with the progress of suburbanization in Japan after the start of COVID-19. On the other hand, while I obtained results consistent with movement from large-scale urban areas to small-scale urban areas as of 2021 similar to Liu and Su (2021), I was unable to obtain results which support that trend as of 2022. Moving forward, in addition to the analysis using statistical methods, I will examine the impact of COVID-19 in more detail by subdividing analysis according to use; for example, housing demand and office demand.
[1] Municipalities with a commuting rate to the core that is above a certain percentage are specified as outlying municipalities.
[2] Municipality boundary data was obtained from the Municipality Map Maker web version (http://www.tkirimura.com/mmm/).
[3] [5] Strictly speaking, it is necessary to consider shifts on the supply side of land. However, since this analysis is focusing on short-term fluctuations, it can be considered that shifts on the supply side are small.
[4] The boundary data of prefectures was created by simplifying the digital national land information "administrative district data" of the Ministry of Land, Infrastructure, Transport and Tourism. Additionally, the boundary data of the mesh was acquired from the package "jpmesh" of the statistical software R.
[Reference]
Liu, Sitian and Su, Yichen (2021), "The impact of the COVID-19 pandemic on the demand for density: Evidence from the US housing market," Economics Letters, 207, 110010.
Yoshitsugu Kanemoto and Kazuyuki Tokuoka (2002), Metropolitan Area Definitions in Japan, Journal of Applied Regional Science, No. 7, pp. 1-15.
Assistant Professor, Faculty of Economics, Chuo University
Areas of Specialization: Urban Economics and Spatial Economics
Chigusa Okamoto was born in Tokyo in 1991. She graduated from the Department of International and Cultural Studies in the College of Liberal Arts, Tsuda University. After the Master’s Program and the Doctoral Program in the Graduate School of Economics, The University of Tokyo, she obtained her Ph.D. (Economics) from The University of Tokyo in 2020. She held positions at the University of Tokyo Center for Research and Education in Program Evaluation (CREPE) and the College of Economics, Rikkyo University. She assumed her current position in 2021. She also continues to serves as a Project Researcher at CREPE.
Her area of expertise is empirical analysis in urban economics and spatial economics.
Her main theses include, Okamoto, Chigusa and Sato, Yasuhiro (2021), “Impacts of high-speed rail construction on land prices in urban agglomerations: Evidence from Kyushu in Japan,” Journal of Asian Economics, 76, 101364, Okamoto, Chigusa (2019), “The effect of automation levels on US interstate migration,” The Annals of Regional Science, 63(3), 519-539, and more.
